Profile

- id: Songmu (ソンムー)
- Masayuki Matsuki
- おそらくはそれさえも平凡な日々 http://www.songmu.jp/riji/
- https://metacpan.org/author/SONGMU
- 趣味はCPANizeでした
- はてな東京オフィス チーフエンジニア
- Mackerel ディレクター

とにかくサーバー状況を可視化・アラート設定

- Go製のmackerel-agent
- ホストの色々なメトリックをよしなに収集
Mackerelによる可視化
テーマ機能
- 色覚サポートテーマも

線グラフ

積み上げグラフ

Alert

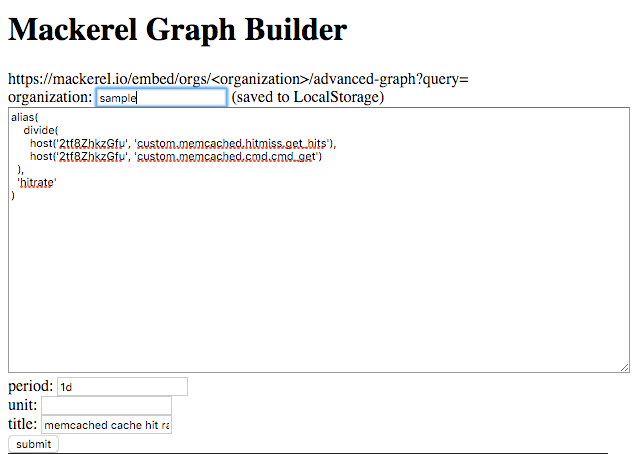
mamcachedのhitrate
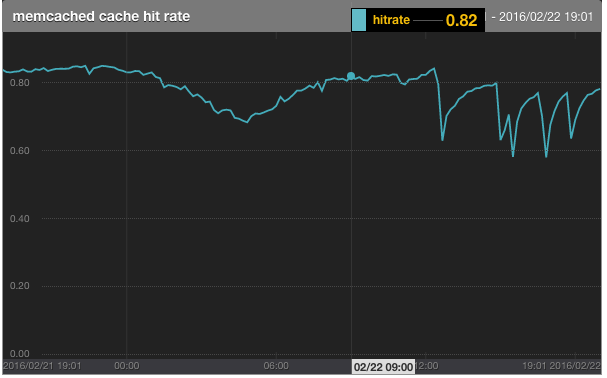
alias(
    divide(
      host('HostIdXXXXX', 'custom.memcached.hitmiss.get_hits'),
      host('HostIdXXXXX', 'custom.memcached.cmd.cmd_get')
  ),
  'hitrate'
)
一週間前の値との比較
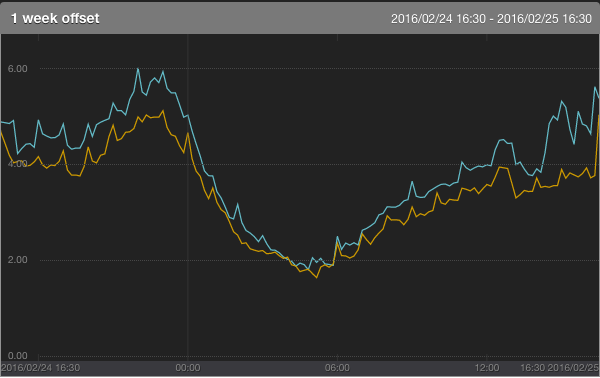
group(
  alias(
    avg(
      timeShift(
        roleSlots('some:app','loadavg5'),
        '1w'
      )
    ),
    'avg-lastweek'
  ),
  alias(
    avg(
      roleSlots('some:app','loadavg5')
    ),
    'avg'
  )
)
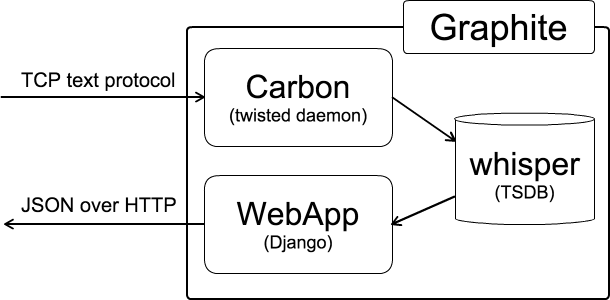
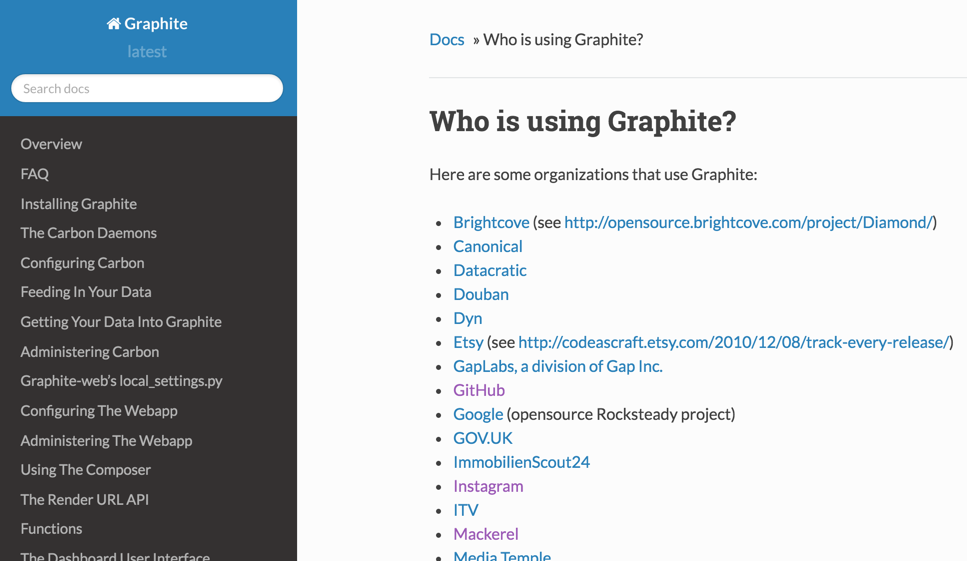
Graphiteの構成
- Carbon (twisted daemon)
- シンプルなtcpテキストプロトコル
% echo "local.random.diceroll 4 $(date +%s)" | nc localhost 2003
- whisper (tsdb file)
- Webapp (Django)
- JSON
- ブラウザでグラフ表示(あまり使われない)
実はLogoがあった

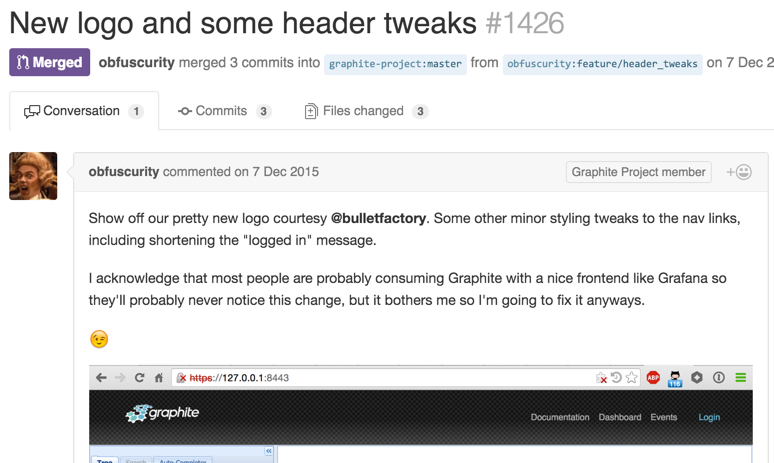
I acknowledge that most people are probably consuming Graphite with a nice frontend like Grafana so they'll probably never notice this change, but it bothers me so I'm going to fix it anyways.
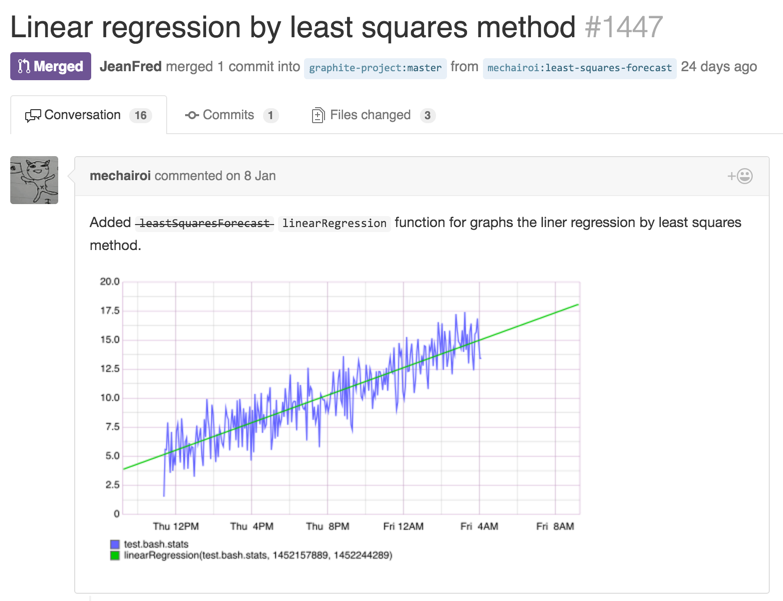
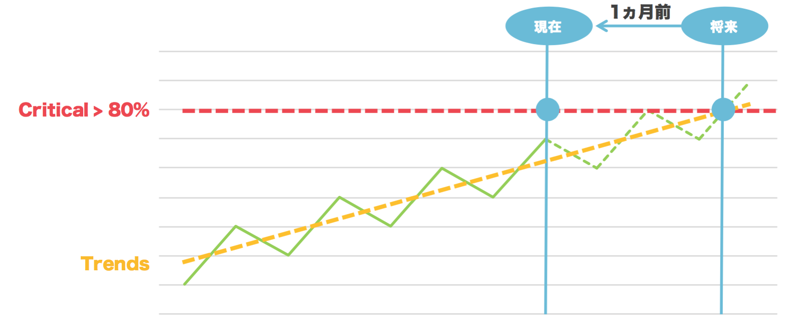
将来予測機能作成中
連続リリース継続中

We are Hiring

- はてなではエンジニアを募集しています
- 東京でも絶賛採用中
- もちろん京都にもおいでやす